All of ESPN.
All In One Place.
Which contenders will make the biggest splash? Here's what we're hearing as 6 p.m. ET on Aug. 3 approaches.
From the deepest positions to the teams with big decisions to make, here's what will shape the deadline.
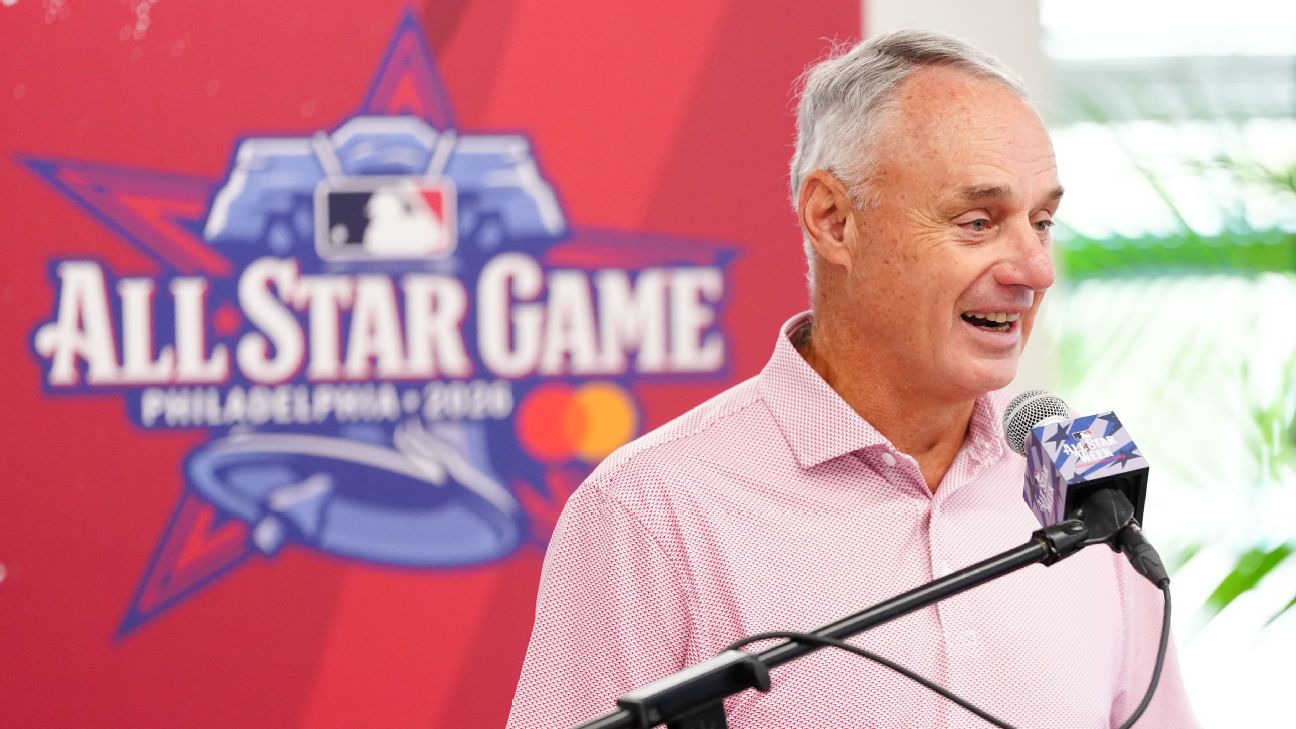
Even during the celebrations of All-Star week, the prospect of a work stoppage -- or a missed 2027 season -- hovered over Philly.
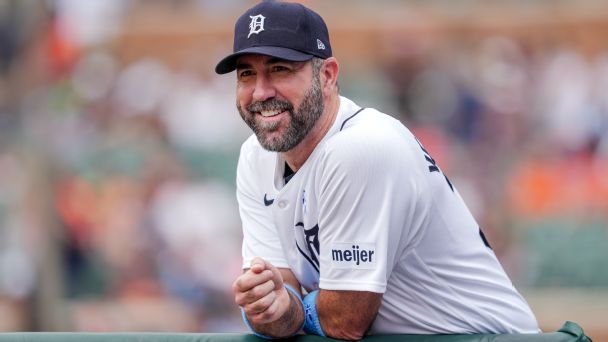
With the future first-ballot Hall of Famer set to retire, his departure helps mark the end of an era for MLB's aces.
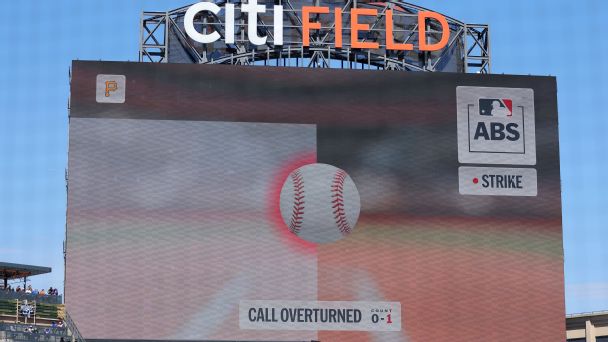
The ABS challenge system leaderboard ranks batters, catchers, teams and umpires throughout the MLB season.
We go deep on the past, present and future of a statistic that is as polarizing as it is powerful.
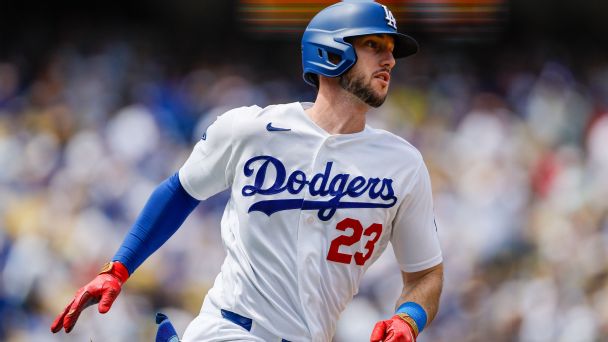
The Dodgers' right fielder is making $60 million this year -- but he hasn't played like it. At least not yet.