


Game Information
Ninja Stadium
| fourth Quarter | |||
|---|---|---|---|
| Time | Team | Play | Score |
| 30:11 |  | H. Rowston Goal | 75 - 103 |
| 28:05 |  | T. Thomas Goal | 75 - 97 |
| 26:38 | | Rushed | 69 - 97 |
| 23:09 | | L. Whitfield Behind | 68 - 97 |
| 18:17 | | N. Larkey Goal | 68 - 96 |
| 17:07 | | T. Bedford Behind | 62 - 96 |
| 14:00 | | J. Hogan Goal | 62 - 95 |
| 12:10 | | N. Larkey Behind | 62 - 89 |
| 7:16 | | T. Powell Goal | 61 - 89 |
| 6:42 | | Rushed | 55 - 89 |
| 4:17 | | Rushed | 55 - 88 |
| 1:55 | | T. Bedford Goal | 55 - 87 |
| third Quarter | |||
| Time | Team | Play | Score |
| 30:42 | | T. Greene Goal | 55 - 81 |
| 28:05 | | T. Greene Goal | 55 - 75 |
| 26:55 | | Rushed | 55 - 69 |
| 21:39 | | J. Riccardi Goal | 55 - 68 |
| 19:14 | | D. Lloyd Behind | 55 - 62 |
| 13:31 | | Rushed | 55 - 61 |
| 11:02 | | N. Larkey Goal | 55 - 60 |
| 9:10 | | X. O'Halloran Goal | 49 - 60 |
| 5:34 | | S. Coniglio Behind | 49 - 54 |
| 4:47 | | C. Coleman-Jones Behind | 49 - 53 |
| 3:16 | | C. Ward Goal | 48 - 53 |
| 1:08 | | N. Larkey Goal | 48 - 47 |
| second Quarter | |||
| Time | Team | Play | Score |
| 27:45 | | N. Larkey Behind | 42 - 47 |
| 21:46 | | T. Greene Behind | 41 - 47 |
| 18:23 | | J. Hogan Goal | 41 - 46 |
| 16:08 | | T. Thomas Goal | 41 - 40 |
| 14:05 | | N. Larkey Goal | 35 - 40 |
| 10:31 | | L. Shiels Behind | 29 - 40 |
| 9:43 | | T. Greene Behind | 28 - 40 |
| 8:30 | | T. Greene Goal | 28 - 39 |
| 7:18 | | T. Thomas Goal | 28 - 33 |
| 5:17 | | E. Ford Goal | 22 - 33 |
| 2:34 | | C. Brown Goal | 16 - 33 |
| first Quarter | |||
| Time | Team | Play | Score |
| 27:37 | | C. Brown Goal | 16 - 27 |
| 26:01 | | C. Brown Goal | 16 - 21 |
| 24:31 | | C. Zurhaar Behind | 16 - 15 |
| 23:57 | | J. Fahey Behind | 15 - 15 |
| 22:14 | | T. Bedford Goal | 15 - 14 |
| 20:30 | | Rushed | 15 - 8 |
| 15:22 | | J. Riccardi Goal | 14 - 8 |
| 9:53 | | G. Wardlaw Goal | 14 - 2 |
| 8:26 | | J. Riccardi Behind | 8 - 2 |
| 6:27 | | C. Coleman-Jones Behind | 8 - 1 |
| 4:11 | | X. O'Halloran Behind | 7 - 1 |
| 3:00 | | P. Spicer Goal | 7 - 0 |
| 0:56 | | Rushed | 1 - 0 |
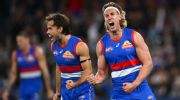
Michael Sellwood was the unlikely hero with a match-saving mark in defence as the Western Bulldogs boosted their AFL finals hopes with a tense four-point win over Collingwood.
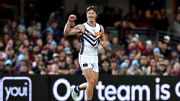
Jye Amiss throws a boot in the air on the goal line to extend Fremantle's lead.
Fremantle's quest for a maiden AFL premiership is gathering steam after they knocked over the Brisbane Lions by 25 points at the Gabba.
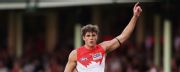
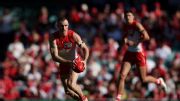
Charlie Curnow has reached new heights for Sydney, kicking eight goals to power the Swans to a 114-point demolition of Richmond.
The Swans go coast to coast and star midfielder Chad Warner salutes for his side's seventh first-term goal against the Tigers.
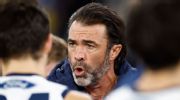
The AFL has conceded umpires should have called for a review to correct what Geelong coach Chris Scott branded a "howler" that robbed his side of a goal in their narrow four-point defeat to Carlton.
| POS | Team | Pts. | % | Form |
|---|---|---|---|---|
| 1 |
 FRE FRE
|
44 | 135.2 | WWWWW |
| 2 |
 SYD SYD
|
40 | 152.4 | WWWLW |
| 3 |
 HAW HAW
|
34 | 114.8 | DLLWW |
| 4 |
 GEEL GEEL
|
32 | 121.9 | WWWWL |
| 5 |
 SUNS SUNS
|
28 | 116.9 | LWWWL |
| 6 |
 MELB MELB
|
28 | 106.7 | WLWWL |
| 7 |
 WB WB
|
28 | 93.7 | LWLWW |
| 8 |
 ADEL ADEL
|
24 | 107.9 | LWWWL |
| 9 |
 BL BL
|
24 | 103.9 | WWLLL |
| 10 |
 COLL COLL
|
22 | 99.9 | DLLWL |
| 11 |
 STK STK
|
20 | 102.3 | WLWLL |
| 12 |
 GWS GWS
|
20 | 98.6 | WLWLW |
| 13 |
 NMFC NMFC
|
20 | 97.6 | LLLLW |
| 14 |
 CARL CARL
|
16 | 87.5 | LLWWW |
| 15 |
 PORT PORT
|
12 | 100.9 | WLLLL |
| 16 |
 WCE WCE
|
12 | 66.1 | LLLWL |
| 17 |
 RICH RICH
|
8 | 60.4 | WLLWL |
| 18 |
 ESS ESS
|
4 | 70.9 | LLLLL |