

Game Information
IKON Park
| fourth Quarter | |||
|---|---|---|---|
| Time | Team | Play | Score |
| 28:32 |  | J. Daicos Behind | 49 - 132 |
| 22:02 |  | J. Hopper Goal | 49 - 131 |
| 18:45 | | B. Hill Goal | 43 - 131 |
| 17:46 | | B. McCreery Behind | 43 - 125 |
| 16:42 | | L. Schultz Behind | 43 - 124 |
| 13:22 | | J. Elliott Behind | 43 - 123 |
| 10:38 | | D. Houston Behind | 43 - 122 |
| 7:36 | | Rushed | 43 - 121 |
| 6:00 | | S. Green Behind | 42 - 121 |
| 2:19 | | L. Fawcett Behind | 41 - 121 |
| 0:34 | | T. Membrey Goal | 40 - 121 |
| third Quarter | |||
| Time | Team | Play | Score |
| 25:25 | | K. McIntosh Goal | 40 - 115 |
| 18:23 | | D. Cameron Goal | 34 - 115 |
| 15:24 | | J. Elliott Goal | 34 - 109 |
| 8:37 | | B. Mihocek Goal | 34 - 103 |
| 5:35 | | J. Elliott Goal | 34 - 97 |
| 3:52 | | B. Hill Goal | 34 - 91 |
| 2:18 | | T. Membrey Goal | 34 - 85 |
| second Quarter | |||
| Time | Team | Play | Score |
| 31:44 | | B. Hill Goal | 34 - 79 |
| 29:46 | | B. Mihocek Goal | 34 - 73 |
| 28:07 | | H. Armstrong Behind | 34 - 67 |
| 26:16 | | S. Sidebottom Goal | 33 - 67 |
| 24:09 | | D. McStay Goal | 33 - 61 |
| 20:38 | | H. Perryman Goal | 33 - 55 |
| 19:28 | | J. Ross Goal | 33 - 49 |
| 17:46 | | B. Mihocek Goal | 27 - 49 |
| 14:23 | | T. Dow Behind | 27 - 43 |
| 12:11 | | R. Mansell Goal | 26 - 43 |
| 11:03 | | T. Nankervis Behind | 20 - 43 |
| 9:35 | | J. Daicos Goal | 19 - 43 |
| 7:23 | | Rushed | 19 - 37 |
| 3:20 | | J. Bauer Goal | 19 - 36 |
| first Quarter | |||
| Time | Team | Play | Score |
| 27:15 | | R. Mansell Behind | 13 - 36 |
| 25:26 | | J. Short Behind | 12 - 36 |
| 24:38 | | R. Mansell Behind | 11 - 36 |
| 22:05 | | D. McStay Goal | 10 - 36 |
| 21:16 | | H. Armstrong Behind | 10 - 30 |
| 19:24 | | T. Membrey Goal | 9 - 30 |
| 18:11 | | D. Houston Goal | 9 - 24 |
| 17:00 | | S. Green Behind | 9 - 18 |
| 14:15 | | Rushed | 8 - 18 |
| 10:56 | | J. Bauer Goal | 7 - 18 |
| 8:22 | | T. Membrey Goal | 1 - 18 |
| 7:21 | | J. Trezise Behind | 1 - 12 |
| 5:10 | | B. Mihocek Goal | 0 - 12 |
| 2:31 | | B. Hill Goal | 0 - 6 |
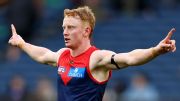
Jake Bowey delivers special message to Jai Arrow after kicking a goal in Melbourne's 46-point win over Richmond.
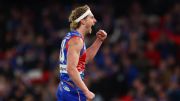
The Western Bulldogs remain in top six contention with 16-point victory over the West Coast Eagles with Aaron Naughton kicking five goals.
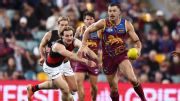
Brisbane Lions were ruthless in a 90-point hiding of the Bombers as Sam Draper kicks a goal against his former side.
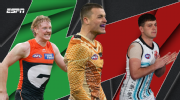
Jack Ginnivan took to water like a duck, but the Cats now face a major injury crisis and we might not see Power superstar Zak Butters in teal again. Here's whose stocks are up and down after Round 18.
There's been a lot of expectation surrounding St Kilda in 2026. Now back in the top 10 with six games to go, the Saints have to validate their improvement by keeping a firm grasp on a finals berth, writes Rohan Connolly.
The Brownlow Medal is the highest individual honour in the AFL. In 2026, ESPN is giving you an advantage with our one-of-a-kind predictor.
| POS | Team | Pts. | % | Form |
|---|---|---|---|---|
| 1 |
 FRE FRE
|
60 | 142.3 | WWWLW |
| 2 |
 SYD SYD
|
52 | 131.2 | WWLWL |
| 3 |
 HAW HAW
|
46 | 114.2 | LWWLW |
| 4 |
 BL BL
|
44 | 117.1 | WWWWW |
| 5 |
 ADEL ADEL
|
44 | 116.9 | WWLWW |
| 6 |
 MELB MELB
|
44 | 109.0 | WWLWW |
| 7 |
 WB WB
|
40 | 92.3 | WLWLW |
| 8 |
 COLL COLL
|
38 | 104.4 | LWWWW |
| 9 |
 GEEL GEEL
|
36 | 115.2 | LWLLL |
| 10 |
 STK STK
|
32 | 106.1 | LWLWW |
| 11 |
 GWS GWS
|
32 | 101.6 | LLLWW |
| 12 |
 CARL CARL
|
32 | 91.9 | WWWWL |
| 13 |
 NMFC NMFC
|
32 | 91.4 | WWWLL |
| 14 |
 SUNS SUNS
|
28 | 95.6 | LLLLL |
| 15 |
 PORT PORT
|
24 | 101.3 | LLWWL |
| 16 |
 WCE WCE
|
16 | 72.0 | LLLLL |
| 17 |
 RICH RICH
|
8 | 63.0 | LLLLL |
| 18 |
 ESS ESS
|
4 | 66.6 | LLLLL |